
Where U.S. Data Center Physical Climate Risk Is Growing Through 2055 | Data Refined #60

Data ReFined is dClimate's newsletter, delivering insights at the intersection of the voluntary carbon market (VCM), digital MRV technologies, climate risk management, and climate intelligence.
Modeled hail damage rises fastest, Hurricane risk continues to dominate the loss tail, and heating and cooling loads create a parallel resilience challenge.
Across the U.S. data center portfolio analyzed here, hail shows the clearest modeled growth through 2055. Hurricane risk remains comparatively stable in the portfolio average but continues to dominate the far loss tail, while heating and cooling degree days point to a separate set of operational resilience pressures.
dClimate's climate risk platform, Aegis, calculates average annual modeled structural loss and expresses it as a damage ratio, defined here as the percentage of a structure's exposure value expected to be damaged in an average year. At the facility level, the ratio is modeled annual structural loss divided by the relevant exposure value; at the regional level, facility losses are aggregated and divided by the exposure value represented within the cell. The period values are annualized averages, not cumulative damage.
Facility locations and attributes came from the FracTracker Alliance National Data Centers Tracker, using a source file accessed July 15, 2026. The Aegis output contains 1,610 normalized location names represented by 1,617 coordinate records across 48 states; no source records were excluded for missing or invalid coordinates. Results use SSP2-4.5 for baseline 2026, 2026–2030, and 2026–2055. The continuously updated tracker is a screening dataset and should not be treated as a complete census of every U.S. data center.
Each normalized location name was assigned the same nominal $1 million total insured value (TIV), split across duplicate coordinate records, producing $1.61 billion of nominal portfolio TIV and equal location weighting. Aegis used the submitted commercial-building characteristics, including floor area where available, although many detailed construction and roof fields were unavailable. SSP2-4.5 is the IPCC's middle-of-the-road pathway. These are screening results for structural damage only; they are not actual portfolio dollar-loss estimates and exclude downtime, lost revenue, and broader business interruption.
Three priorities for data center owners and insurers
- Treat hail and severe convective storms as a portfolio-wide resilience issue. Review roof systems and coverage across central and eastern markets. Rooftop equipment, cooling infrastructure, backup generation, downtime, and business continuity are broader resilience considerations beyond the structure-only loss estimates.
- Use damage ratios to prioritize engineering, then apply them cautiously to actual values. A ratio can support an actual structural-loss estimate only when the modeled building characteristics and vulnerability assumptions remain applicable.
- Keep frequent damage and tail risk in view together. Hurricane dominates extreme return periods, while hail changes faster and becomes more important at frequent return periods. Insurance terms and mitigation plans should reflect both parts of the distribution.
The rest of this article provides the methodology, maps, and location- and portfolio-level findings that support these priorities.
Hail is the clearest growth signal
Among the three perils mapped in detail, hail begins with the highest location-weighted portfolio damage ratio and increases the fastest.
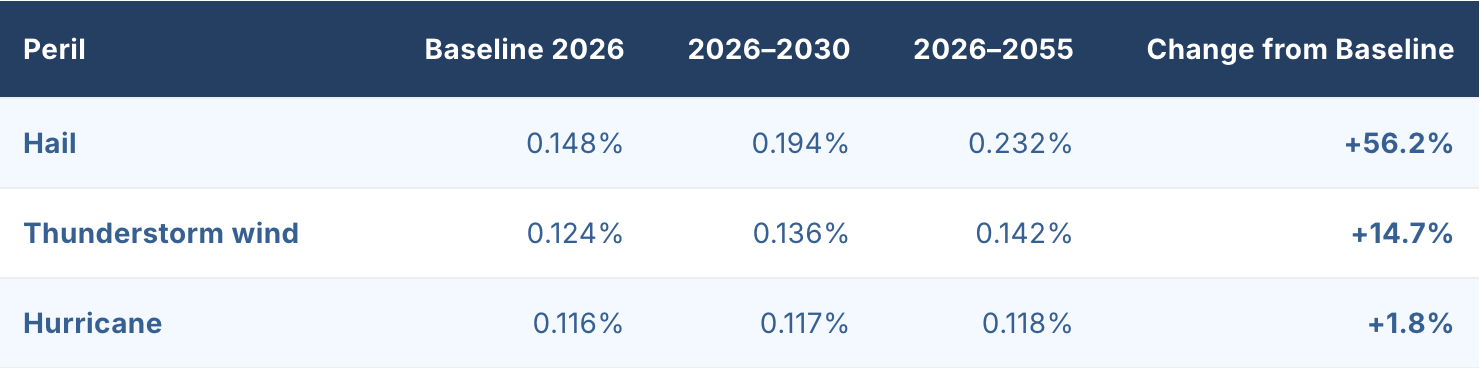
By 2026–2055, hail's damage ratio is roughly 64% higher than thunderstorm wind and nearly twice the Hurricane ratio. Thunderstorm wind also rises, but more slowly. Hurricane is comparatively stable at the portfolio level.
Other modeled perils—not shown in the maps—follow a mixed pattern. Tornado and wildfire damage ratios also rise through 2026–2055, while excessive rainfall declines for this particular scenario and portfolio. The rainfall result should not be interpreted as a general forecast of declining rainfall risk.
Normalizing by cell TIV reveals the hazard geography
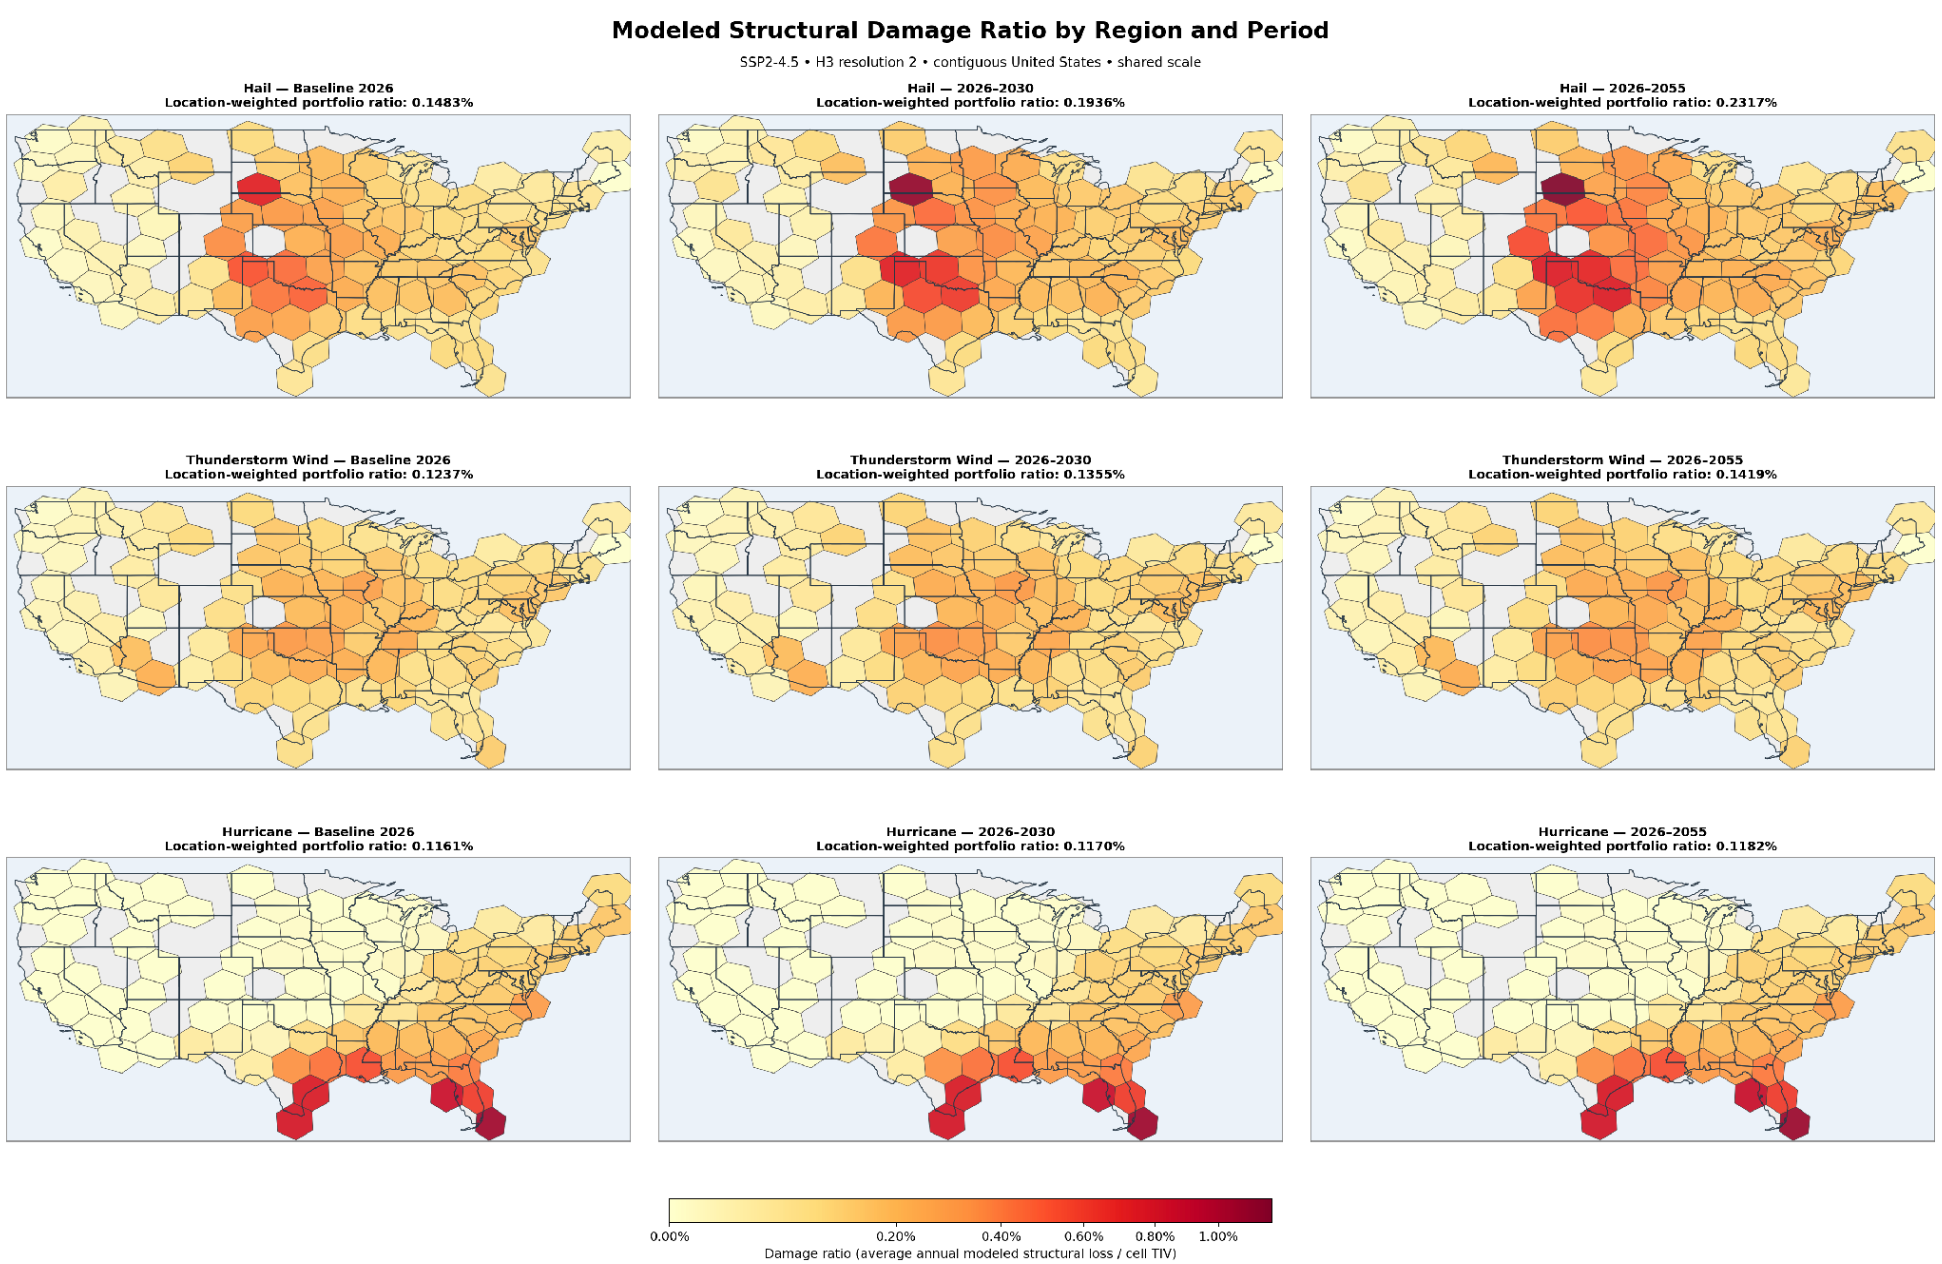
Each map cell's damage ratio equals average annual modeled structural loss aggregated within the cell divided by the nominal TIV assigned to locations in that cell. With equal nominal TIV per location, a dense data center market does not appear more severe merely because it contains more facilities.
Results are aggregated to H3 resolution 2—large hexagonal screening regions averaging about 86,802 square kilometers—and should not be read as uniform risk throughout a cell. Only cells containing a represented facility are colored. White cells indicate no represented facility and no assigned TIV, not zero modeled hazard. The maps show the contiguous United States; Alaska and Hawaii remain in the site- and state-level rankings. With concentration effects normalized, distinct geographic patterns emerge:
- Hail: The highest ratios occur across the central United States and High Plains, with the signal strengthening and spreading by 2026–2055.
- Thunderstorm wind: Elevated ratios cover a broader central and eastern corridor. The increase is visible but less pronounced than for hail.
- Hurricane: The strongest ratios remain concentrated along the Gulf Coast, southern Texas, Florida, and parts of the southeastern Atlantic coast.
This view supports regional screening. It answers a different question from a concentration map: not 'where is the most value accumulated?' but 'where is the greatest percentage of annual structural damage modeled relative to the nominal value represented there?' Site-level engineering analysis is still required.
Hurricane remains the dominant tail-risk peril
Although Hurricane changes little over time, it remains the dominant modeled tail-risk peril on the occurrence exceedance probability (OEP) curve. OEP describes the probability that the largest single-event loss in a year exceeds a given level; a 1-in-1,000-year point corresponds to a 0.1% annual exceedance probability. The Hurricane OEP damage ratio is 1.192% at baseline and 1.214% for 2026–2055.
The combined severe-convective-storm category—an umbrella category covering hail, thunderstorm wind, and tornado—has a smaller starting ratio but a steeper trajectory:
- The 1-in-1,000-year severe-convective-storm ratio rises from 0.554% to 0.732%, an increase of 32.2%.
- At a 1-in-100-year return period, the hail ratio rises from 0.239% to 0.329%, an increase of 37.6%.
- At the more frequent 1-in-5-year return period, hail rises from 0.0477% to 0.0805%, an increase of 68.7%.
- The 1-in-1,000-year earthquake ratio is included as a non-climate comparator and is held constant at 0.671%. Severe convective storm risk moves from below that level at baseline to above it in 2026–2055.
The practical implication is a two-part insurance story. Hurricane continues to dominate the far tail, while hail and severe convective storms increasingly shape more frequent damage. Catastrophe limits remain important; deductibles, roof coverage, and recurring-event terms also merit review. Equipment protection, downtime, and business continuity are broader resilience implications, not losses directly quantified by this structure-only model.
Individual wildfire sites remain important outliers
Portfolio averages can obscure unusually exposed facilities. The highest baseline site-level damage ratio in the analysis belongs to the Fort Hood site in Texas for wildfire, at 5.55%. It rises to 6.30% for 2026–2055.
Other persistent wildfire outliers include facilities near Reno, Nevada; Global Stack Data Center in California; Lex Developments in Idaho; and Project Taurus in Colorado. Hurricane sites in Florida, coastal Texas, and Louisiana occupy several of the remaining top positions. In 2026–2030 and 2026–2055, a South Dakota hail site also enters the top ten.
These results support two complementary views:
- Regional damage ratio, which identifies areas where modeled structural damage is high relative to cell TIV.
- Facility damage ratio, which identifies individual properties that may warrant engineering review even when they sit outside the largest data center markets.
Risk scores confirm the convective trend
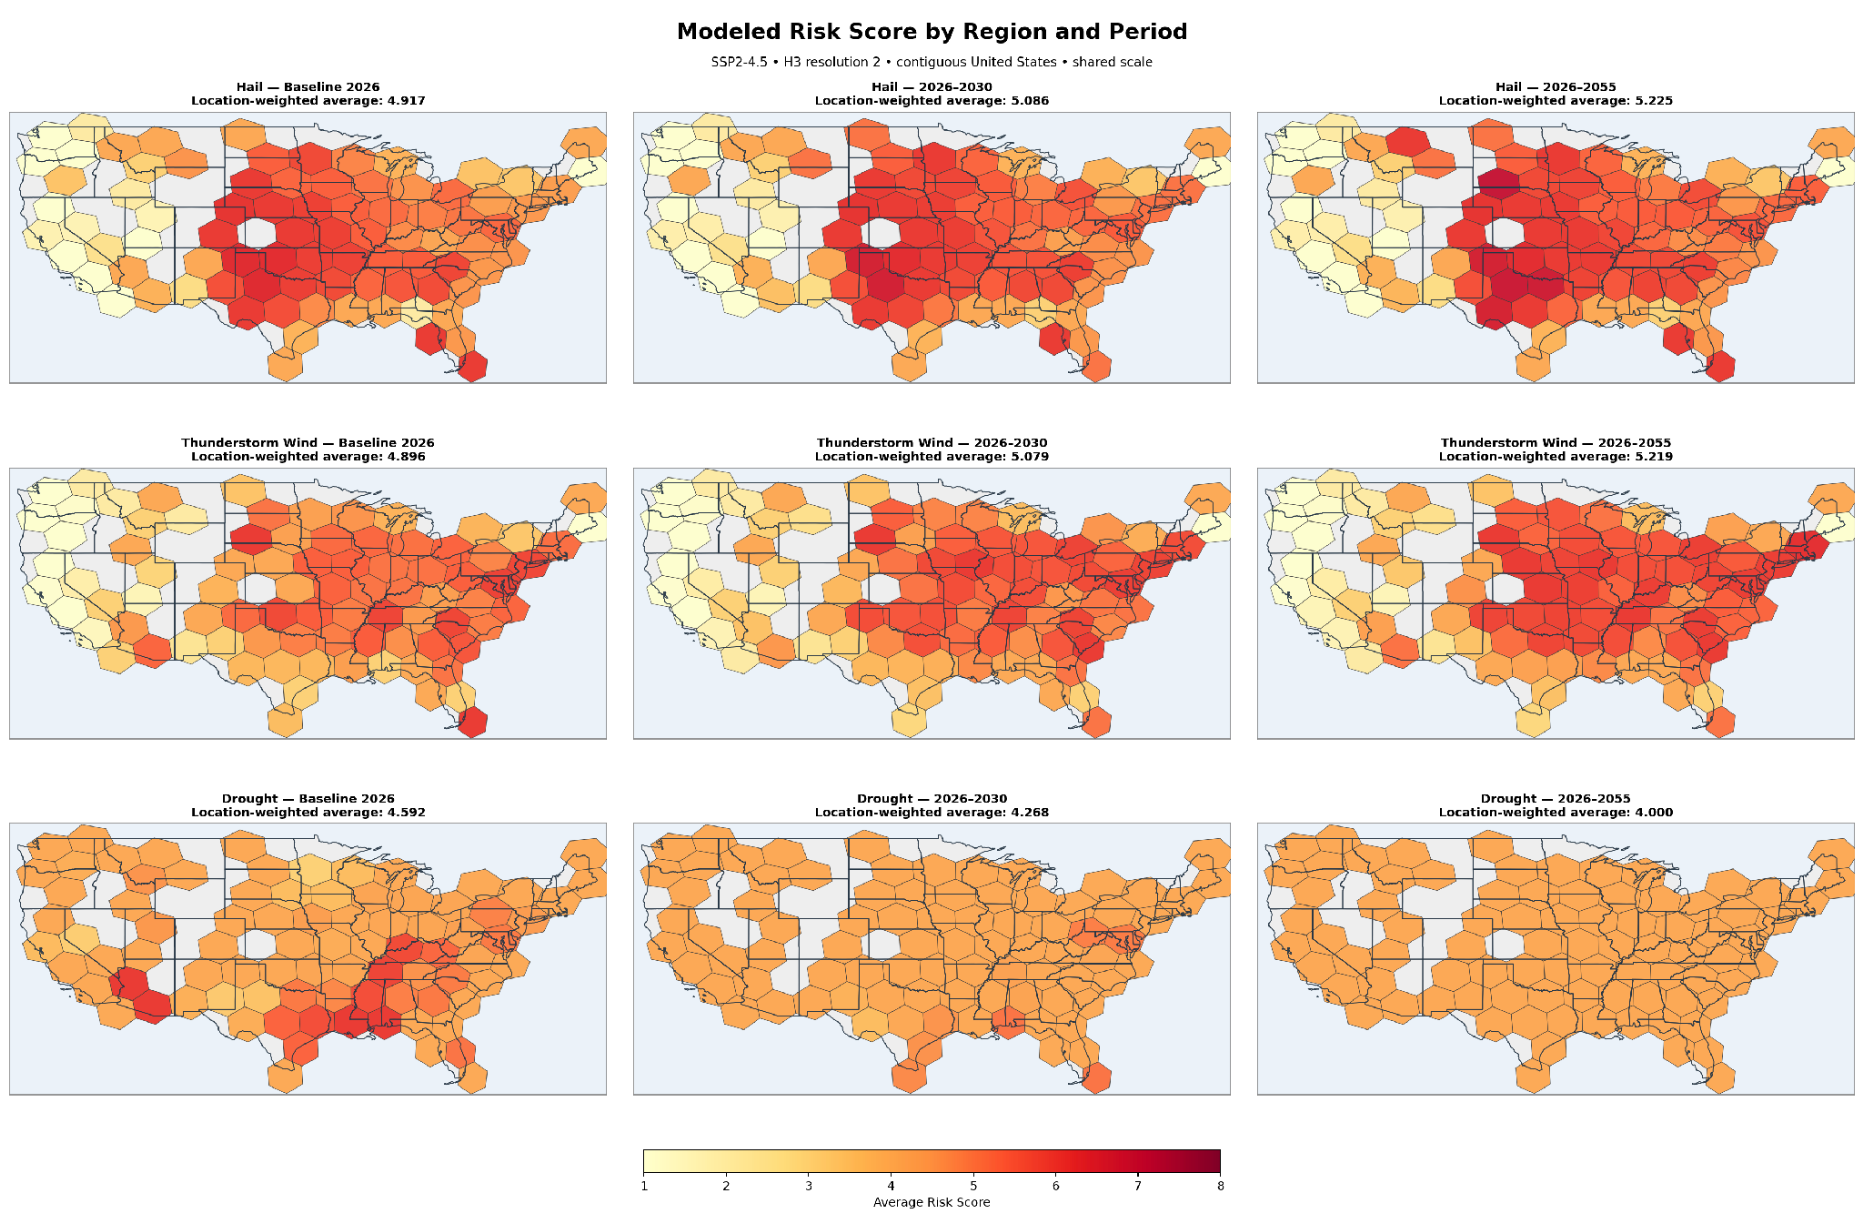
Risk scores offer a second, value-independent measure of hazard-only risk. Aegis scores run from 1 (low) to 10 (high); the three mapped perils span 1–8 in this assessment. Higher scores indicate higher modeled hazard risk, not a loss percentage or probability. Each H3 cell is the simple, unweighted mean across represented facility records; no TIV weighting is used.
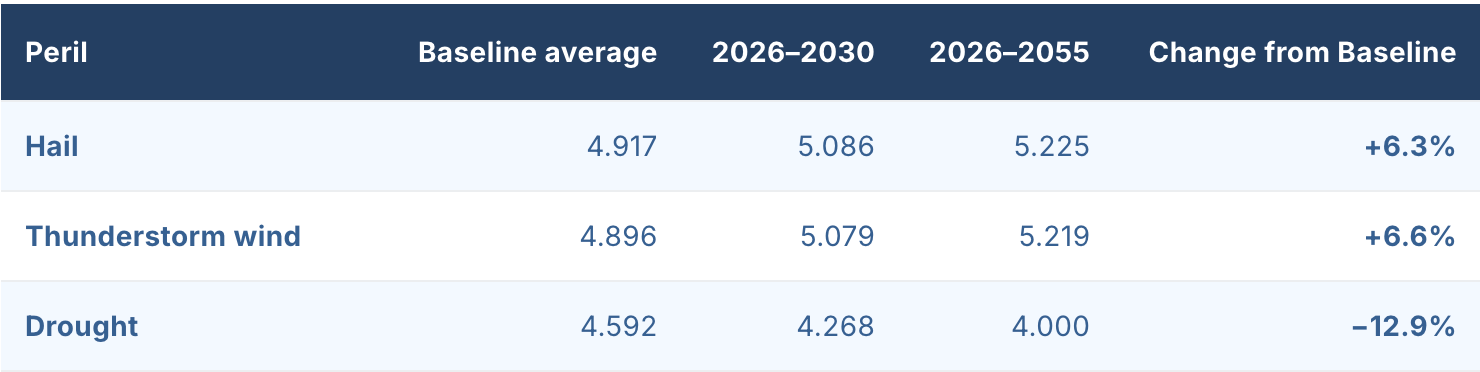
Hail and thunderstorm wind expand across a broad central and eastern corridor. By 2026–2055, their portfolio-wide averages are nearly identical. Drought moves lower and becomes more geographically uniform in the selected metric. As with excessive rainfall, that is a model result for this scenario and portfolio rather than a universal drought forecast.
The top-location results add useful context. Alaska's Prudhoe Bay and STAK Energy facilities retain cold-risk scores of 8. For 2026–2055, Data Center THM1A in Texas also reaches a hail score of 8, while Markley Data Center 2 in Massachusetts appears with a thunderstorm-wind score of 7. High scores therefore reflect different operating challenges across the portfolio.
How to read the map: Colored hexagons show the average facility risk score in each occupied H3 cell. White cells contain no represented facility. Large resolution-2 regions support national screening, not uniform local-risk interpretation.
State averages identify leaders—and emerging areas
The state-level figures are cross-peril means: the simple average of facility-peril damage ratios across all modeled perils and represented locations in each state. On this basis, Idaho is highest in all three periods, moving from 0.112% at baseline to 0.134% for 2026–2055. Louisiana, Oklahoma, and Texas form the next tier at roughly 0.092%–0.096%.
Relative growth highlights a different group. Montana nearly doubles from a low base, while Minnesota, South Dakota, Colorado, and several northwestern states also post large percentage increases. These changes warrant follow-up, but growth rates should always be read alongside facility counts and starting ratios.
State-average risk scores are more compressed. The leaders generally sit near 3, while within-state standard deviations are often around 1.7–2.0. Facility-level variation is therefore more useful for decision-making than small differences between state averages.
Cooling and heating loads create a parallel resilience challenge

Cooling degree days (CDD) and heating degree days (HDD) measure cumulative deviation of daily mean temperature above or below a 65°F base. Higher values indicate greater annual cooling or heating demand. The rankings reveal a persistent operational divide.
Cooling demand is concentrated in the desert Southwest. Imperial Data Center Project and a cluster of Phoenix-area facilities exceed 5,000 average annual CDD. Maricopa Data Center leads for 2026–2055 at approximately 5,248 CDD.
Heating demand is even more pronounced at the northern edge of the portfolio. STAK Energy and Prudhoe Bay exceed 17,000 HDD in the baseline and 2026–2030 views. STAK remains the 2026–2055 leader at approximately 16,733 HDD, followed closely by Prudhoe Bay. Montana, North Dakota, Minnesota, and Maine dominate the rest of the top ten.
These are not damage ratios, but they inform resilience planning. High-CDD locations may face sustained cooling loads and power or water constraints; high-HDD locations may face cold-weather reliability, freeze-protection, and fuel-security demands. These are operational interpretations, not losses quantified by the structural-damage model.
Thank You For Reading Our Newsletter! 💙
We greatly appreciate your interest and support! If you enjoyed this newsletter, please consider forwarding it to your network to increase awareness of these critical climate topics.
About dClimate
dClimate’s decentralized and open climate data infrastructure powers a wide range of applications, including climate risk assessments, parametric insurance, and climate intelligence platforms for carbon and commodity markets.
⛅ Visit our website | 📊 Discover our products
Join the dClimate Community!
We welcome your comments, feedback, and likes. Follow us on the channels below to stay updated and start building in our decentralized climate data ecosystem. 👇
