Case Study: Climate Risk Assessment for Retail
The retail industry faces extreme climate risks across its supply chains and executives are pressured to consider these risks in their decision-making. dClimate, a data-driven climate solutions ecosystem, utilizes its extensive climate data to develop solutions that address emerging climate needs, particularly physical climate risks. Through research and analysis, dClimate has created Aegis, an advanced physical risk assessment tool.
Aegis provides the probability of a climate event occurring for a specific asset or location, along with the associated financial loss. It also offers a risk scale to help decision-makers prioritize assets or locations based on climate risk.
Request Early Access to Aegis
If you are interested in Aegis, please fill out this brief form to request early access to our novel climate risk assessment platform.
Physical Climate Risks Causing Supply Chain Disruptions
Supply chain disruptions cause interruptions in operations, human capital, and financial planning of businesses. Retailers can make better financial and operational decisions by measuring and understanding the impact of climate risk on supply chains.
Aegis provides estimates on the probability of a climate peril occurring in the location of an asset (such as retail storefronts, warehouses, data centers, et cetera), the financial losses for the asset due to a climate peril, as well as a risk scale to determine which assets or locations are more vulnerable to the risk associated with a climate peril.
For example, a retailer can obtain climate risk data from Aegis on proposed suppliers and enable the retailer to determine which supplier is most (or least) vulnerable to environmental impacts.
Aegis can help retailers understand how a heatwave or a potential tropical cyclone may impact setting up a retail storefront or an existing store in a particular location. Through this analysis, business executives can plan potential revenue, human capital, and other associated operational disruptions due to weather risk.
Retail business executives can take action to minimize potential financial losses by understanding how different climate perils can affect associated infrastructure.

Case Study: North American Major Retailer
In this article, we focus on a physical risk assessment case study conducted for one of the largest retailers in North America. We compiled and analyzed roughly 2300 locations across North America (Canada, the US, and Mexico).
In order to build a climate risk assessment for this retail's locations across North America, we made a few assumptions:
- Average size - 105,000 square feet
- Average cost per square foot for construction costs for a typical retail building in the US - 145 USD per square foot
Using the above estimates the average construction cost for this retailer’s stores would be around 15 million USD. Using construction costs is a reasonable estimate of the value of an asset, but does not cover all the content inside and other valuable parts of the asset.
Note that the assumptions mentioned are focused on average cost per asset. However, an asset can have other factors such as building materials, content, and others that contribute to the total value of an asset. With more information on such factors, the risk assessment tool can provide more granular/precise results around potential losses associated with an asset.
Time Period and Climate Scenario
For this assessment, we examined the time period 2030-2040. We looked at climate conditions under the climate scenario SSP245, which refers to a world where economic growth and development continue along a path that is heavily reliant on fossil fuels, resulting in high greenhouse gas emissions and moderate global warming. Under this scenario, global temperatures are expected to rise 2.1 to 3.5°C by 2100.
Climate Perils
Aegis calculates the risk for each of the following perils - Cold Outbreak, Heat Wave, Earthquake, Excessive Rainfall, River Flooding (undefended and defended), Hurricane, Tsunami, Wildfire, Hail (US), Thunderstorm Winds (US), and Tornadoes (US), using the time period and other inputs around scenarios and asset value as mentioned above. Users have the flexibility to choose from a variety of perils that best suits their assessment needs, e.g. you could only any number or all of the perils listed above.
The risk for these perils can be assessed at either the individual location or the portfolio level.
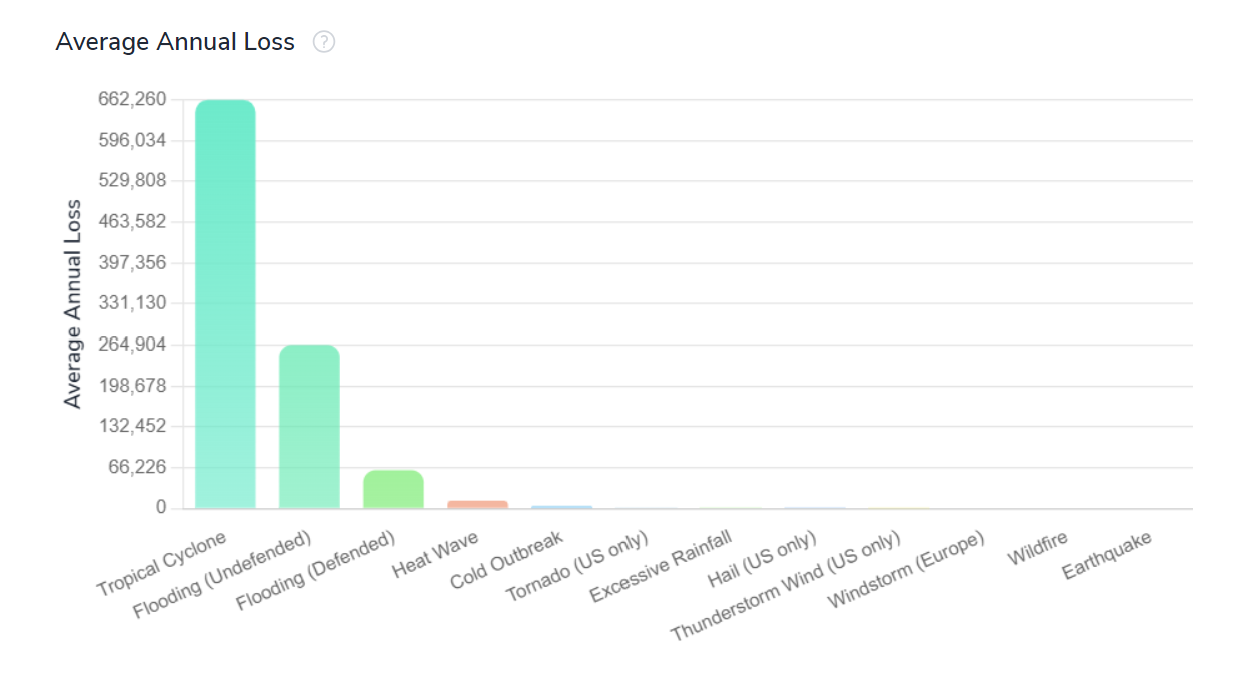
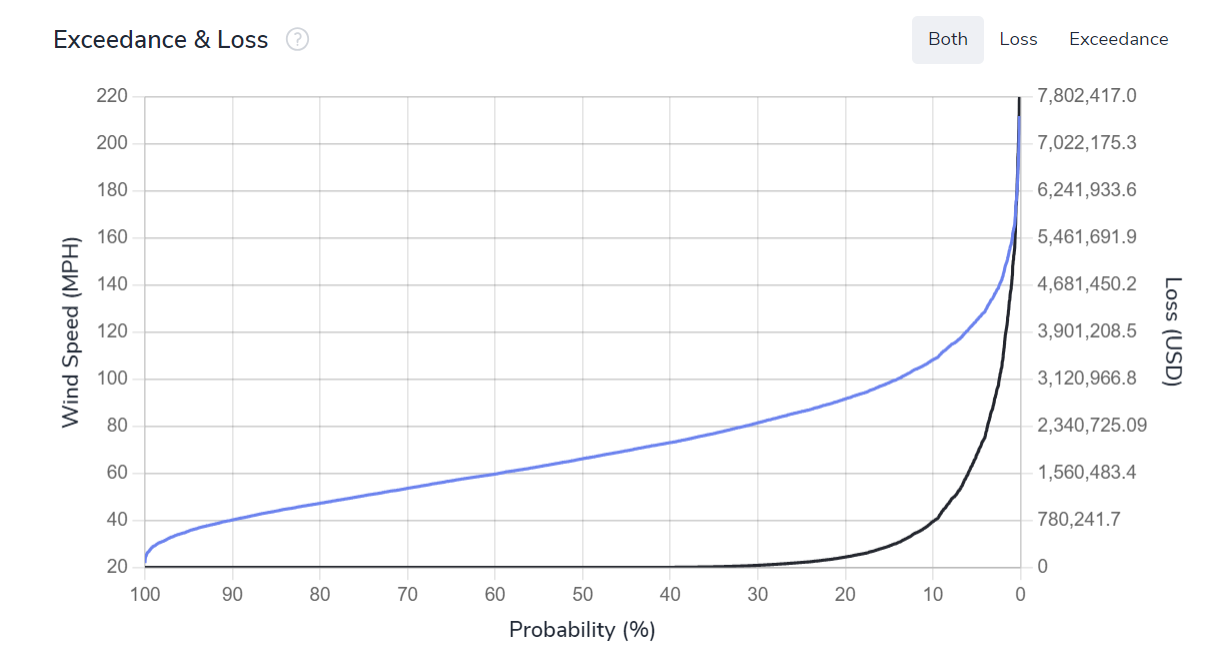
At the individual level, analyses such as the probability of exceeding a certain magnitude of an extreme event are calculated and displayed along with the potential loss due to that magnitude. AAL, or Average Annual Loss, is determined for each asset location to estimate the expected loss in a specific year in the event of a particular hazard.
When assessing the overall portfolio, AAL is represented on maps or bar charts to show the cumulative expected loss across all assets. Risk, calculated from expected losses and peril probabilities, at a portfolio level is also displayed.
Assessment Results for an Individual Asset
Output examples for an individual asset are shown below.
Summary of Average Annual Losses
Exceedance Probability and Expected Loss
Assessment Results for a Portfolio
Portfolio Analysis of all locations across North America.
Portfolio Total AAL by Peril
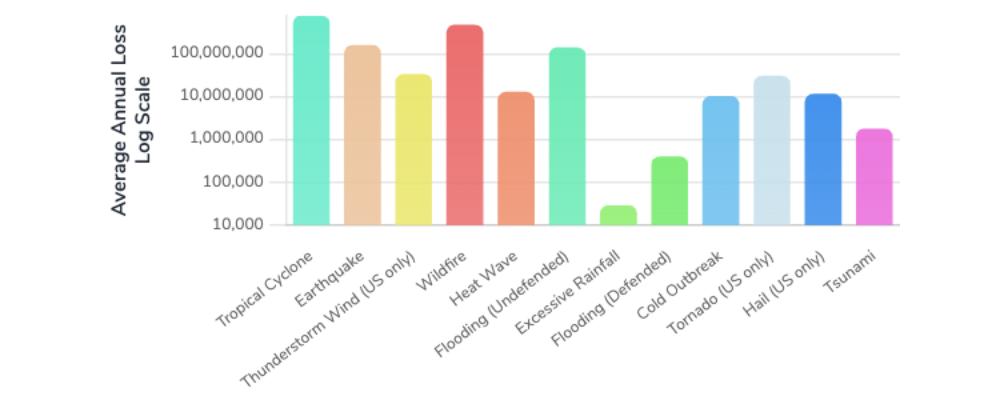
The highest AAL is associated with Tropical Cyclones or Hurricanes followed closely by Wildfires, Earthquakes, and River Flooding for undefended zones. Tropical cyclones can be devastating for many communities and are likely to continue to worsen in the future. River flooding, especially in areas with no defense, is already a large cause of loss. Undefended floods can potentially be a significant portion of the loss for this portfolio in the future.
Below is a chart showing the AAL separately for the US, Mexico, and Canada.
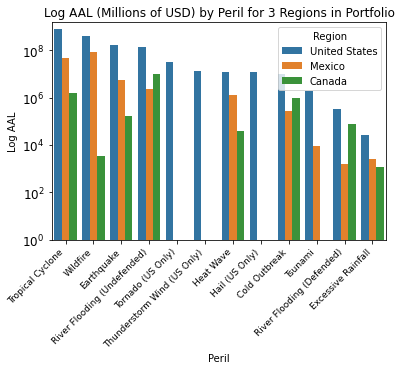
In the US, the threat of flooding, wildfires, hurricanes, and tsunamis dominates the AAL for the retailer's store locations in this case study. Flooding, wildfires, and hurricanes also are the most costly for Mexico. Most of the retailer's locations we analyzed in Canada were located in eastern Canada. The main perils to cause the most loss in that region were flooding, cold outbreaks, and excessive rainfall.
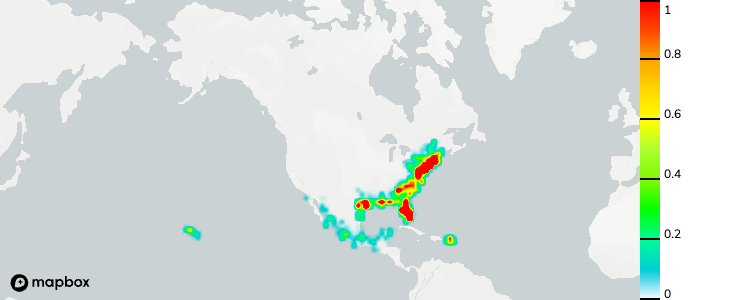
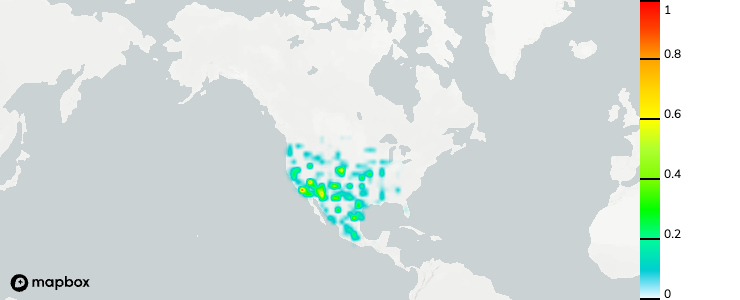
We also showcase risk scores as part of our climate risk assessments for a portfolio. The maps below show risk scores for the top three perils for this portfolio.
Tropical Cyclone Risk Score
Wildfire Risk Score
Earthquake Risk Score
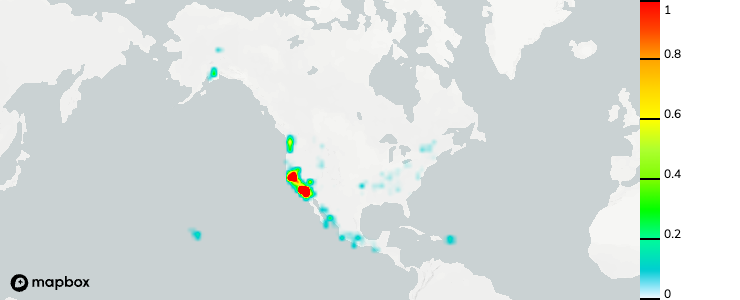
Risk is high for many asset locations across the US Southeast, US East Coast, and eastern Mexican coastline for Tropical Cyclones. Using more robust building materials for these locations in the future could be a good way to combat the increasing intensity and frequency of landfalling hurricanes.
Cold Outbreak Average Annual Loss (USD)
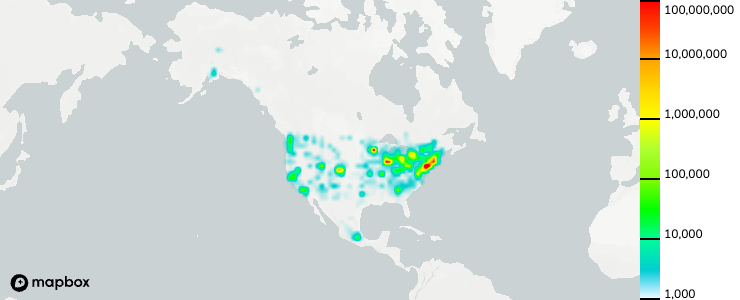
Other perils like Cold Outbreaks or Heat Waves have a lower associated financial loss. Still, increased energy costs for heating and cooling in the future are likely to reshape building practices both in functionality and location.
Conclusion
Based on this climate risk assessment, Tropical Cyclones, Wildfires, Earthquake, and River Flooding will likely lead to the highest average annual losses and pose the most risk for retail stores in this portfolio.
Next Steps After a Physical Climate Risk Assessment
Some next steps that retailers can take based on a physical climate risk assessment include:
- With growing consumer concerns around sustainability and regulatory pressures around climate risk considerations for business planning, retailers can use the estimates from a physical risk assessment to incorporate the analysis as a part of their corporate ESG strategies.
- Investors in retail businesses can use estimates from a physical risk assessment conducted on a portfolio of assets to determine how the weather may impact their investments over a period of time, enabling better investment decisions.
- Insurance against the assessed climate risks is an efficient next step for the industry to mitigate expected losses due to weather damage. Climate risk assessment enables institutions to integrate the results into their internal risk management frameworks or transfer the risk to an external vendor.
- Retail businesses are also going through a change of digitization. This means retailers are not only concerned about climate risk impact on warehouses and distribution centers but also setting up data centers to operate e-commerce platforms. These data centers are also at direct risk of climate change and conducting physical climate risk assessments will help retailers plan for the next wave of reaching customers.
Sign Up for Early Access!
For more information on Aegis please visit our website. For early access to the platform, sign up via the button below.
Contact us today (community@dclimate.net) to schedule a demo for our comprehensive climate risk platform.
💽 Explore 40+ TB of free climate data via our Data Marketplace and API
🌐 Visit our Website, Blog, and Documentation
📰 Sign up for our bi-weekly Newsletter
🥳 Join the community: Twitter | LinkedIn | Discord | Telegram | YouTube


