
dClimate’s Data Infrastructure Used by InclusionBridge Students to Find Optimal Locations for Wind Energy in the US

Earlier in 2023, dClimate announced a partnership with InclusionBridge, a non-profit organization that supports underserved high schoolers and students looking to pursue careers in data science.
InclusionBridge gives students access to dClimate’s data infrastructure and data tools as part of this partnership. This enables students to practice their data science skills using real-world data and work on developing meaningful solutions for climate-related problems.
As part of InclusionBridge’s after-school program, three students leveraged climate data via dClimate’s API and Marketplace to determine the optimal locations for an onshore wind park in the United States.

Climate Data
The datasets used in this project originated from Copernicus, a European agency that designs and operates weather satellites that generate high-quality climate information. Climate scientists worldwide utilize Copernicus’ ERA5 datasets due to their reliability and accuracy. These datasets are openly made available on dClimate’s API.
Specifically, this study project was made possible by the following datasets, accessed from dClimate’s data infrastructure:
- ERA5 Hourly Global v-Wind with Precision of 100m [download here]
- ERA5 Hourly Global u-Wind with Precision of 100m [download here]
- ERA5 Hourly Global Surface Solar Radiation [download here]
Data Marketplace
The dClimate data marketplace is arguably the easiest way to utilize institutional-grade climate information like this. Explore dozens of datasets, upload and monetize your own data, and advance climate science via our platform. 👇
The benefit of using dClimate’s data marketplace is that these large datasets have been through an ETL (extract, transform, load) pipeline. This process standardizes and cleans the data so it is easier to use. Moreover, the ETL pipeline transforms the ERA5 datasets into the Zarr data architecture.
The Zarr file format lets users easily select a geographic region and date range directly from the user interface of dClimate’s data marketplace. So instead of downloading the entire ERA5 dataset of 1.6 terabytes, the students could download a fraction of this, speeding up their workflow significantly.
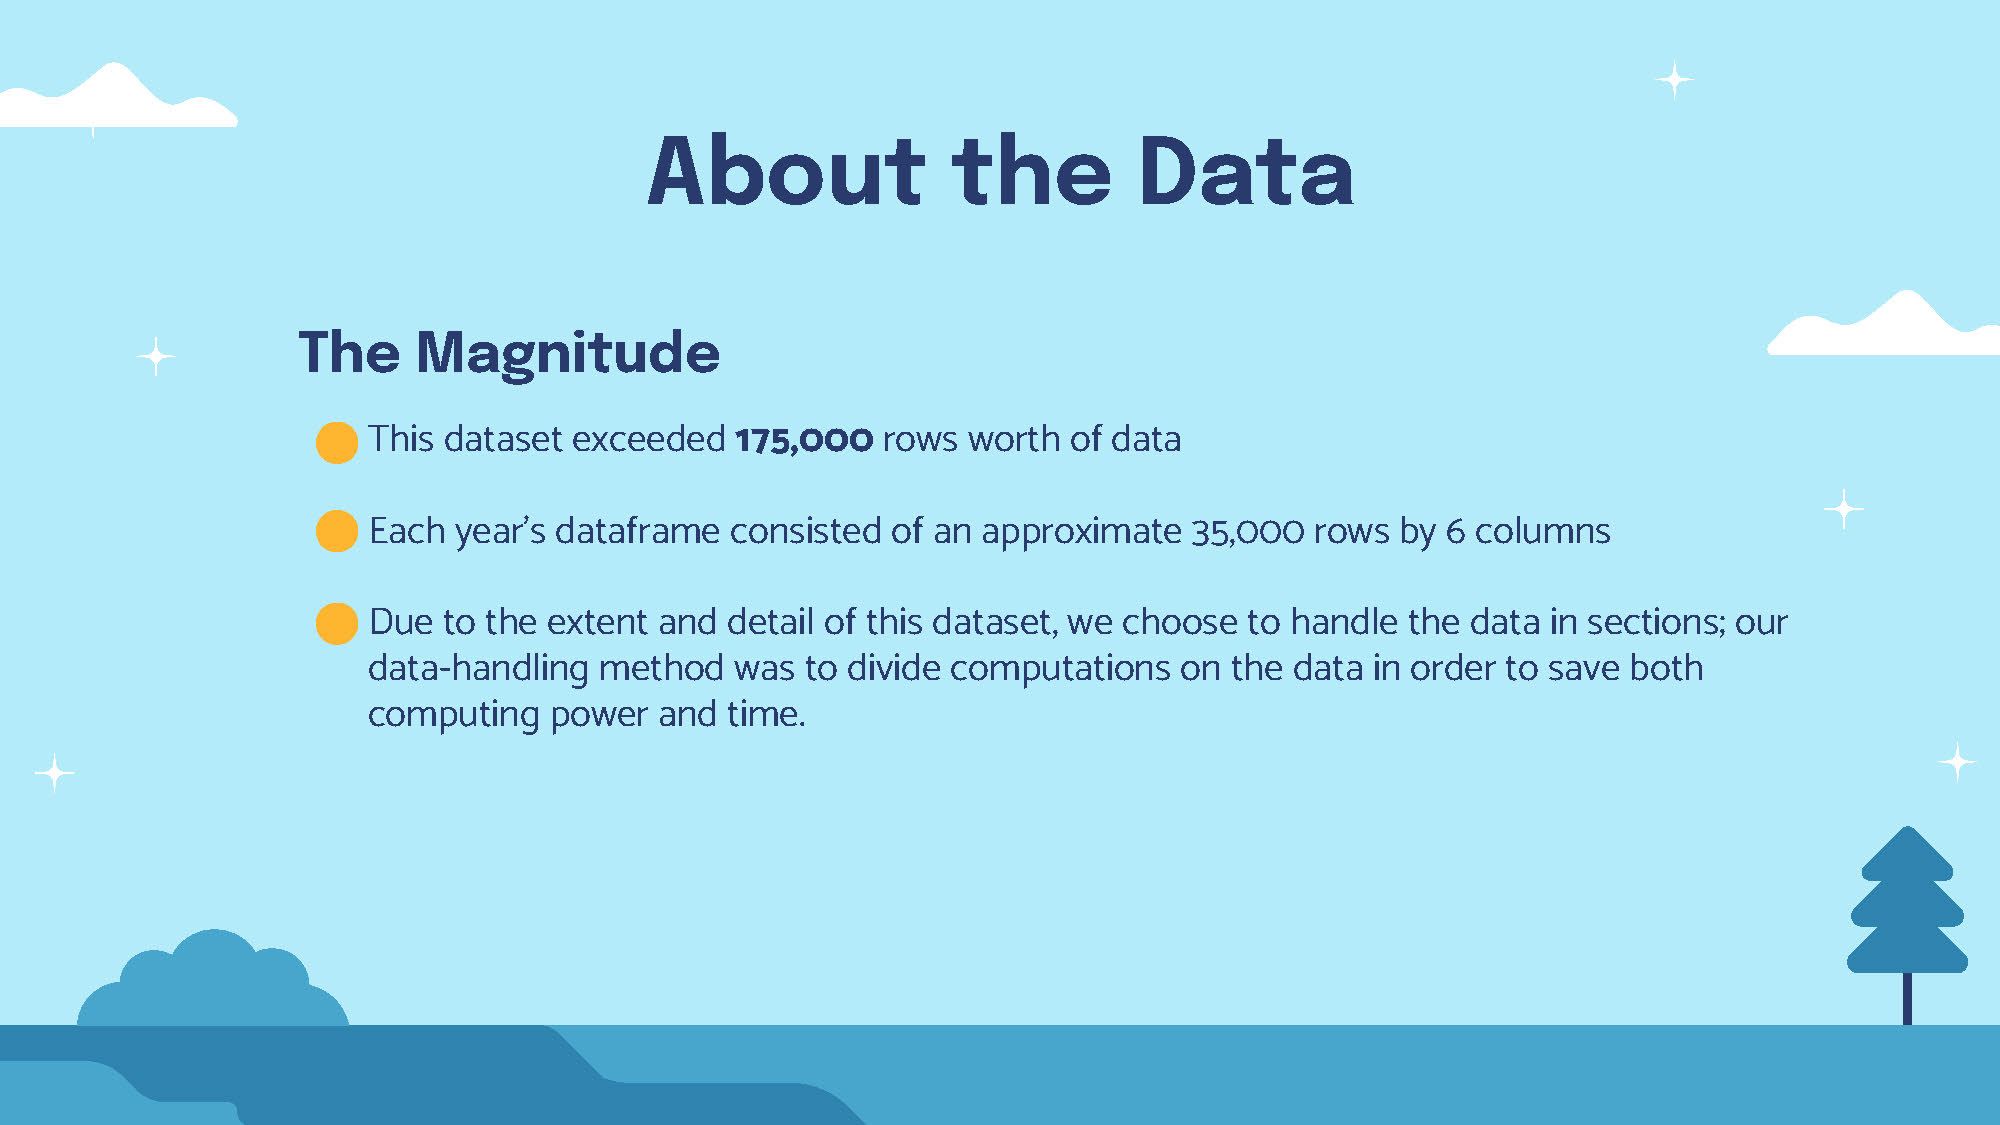
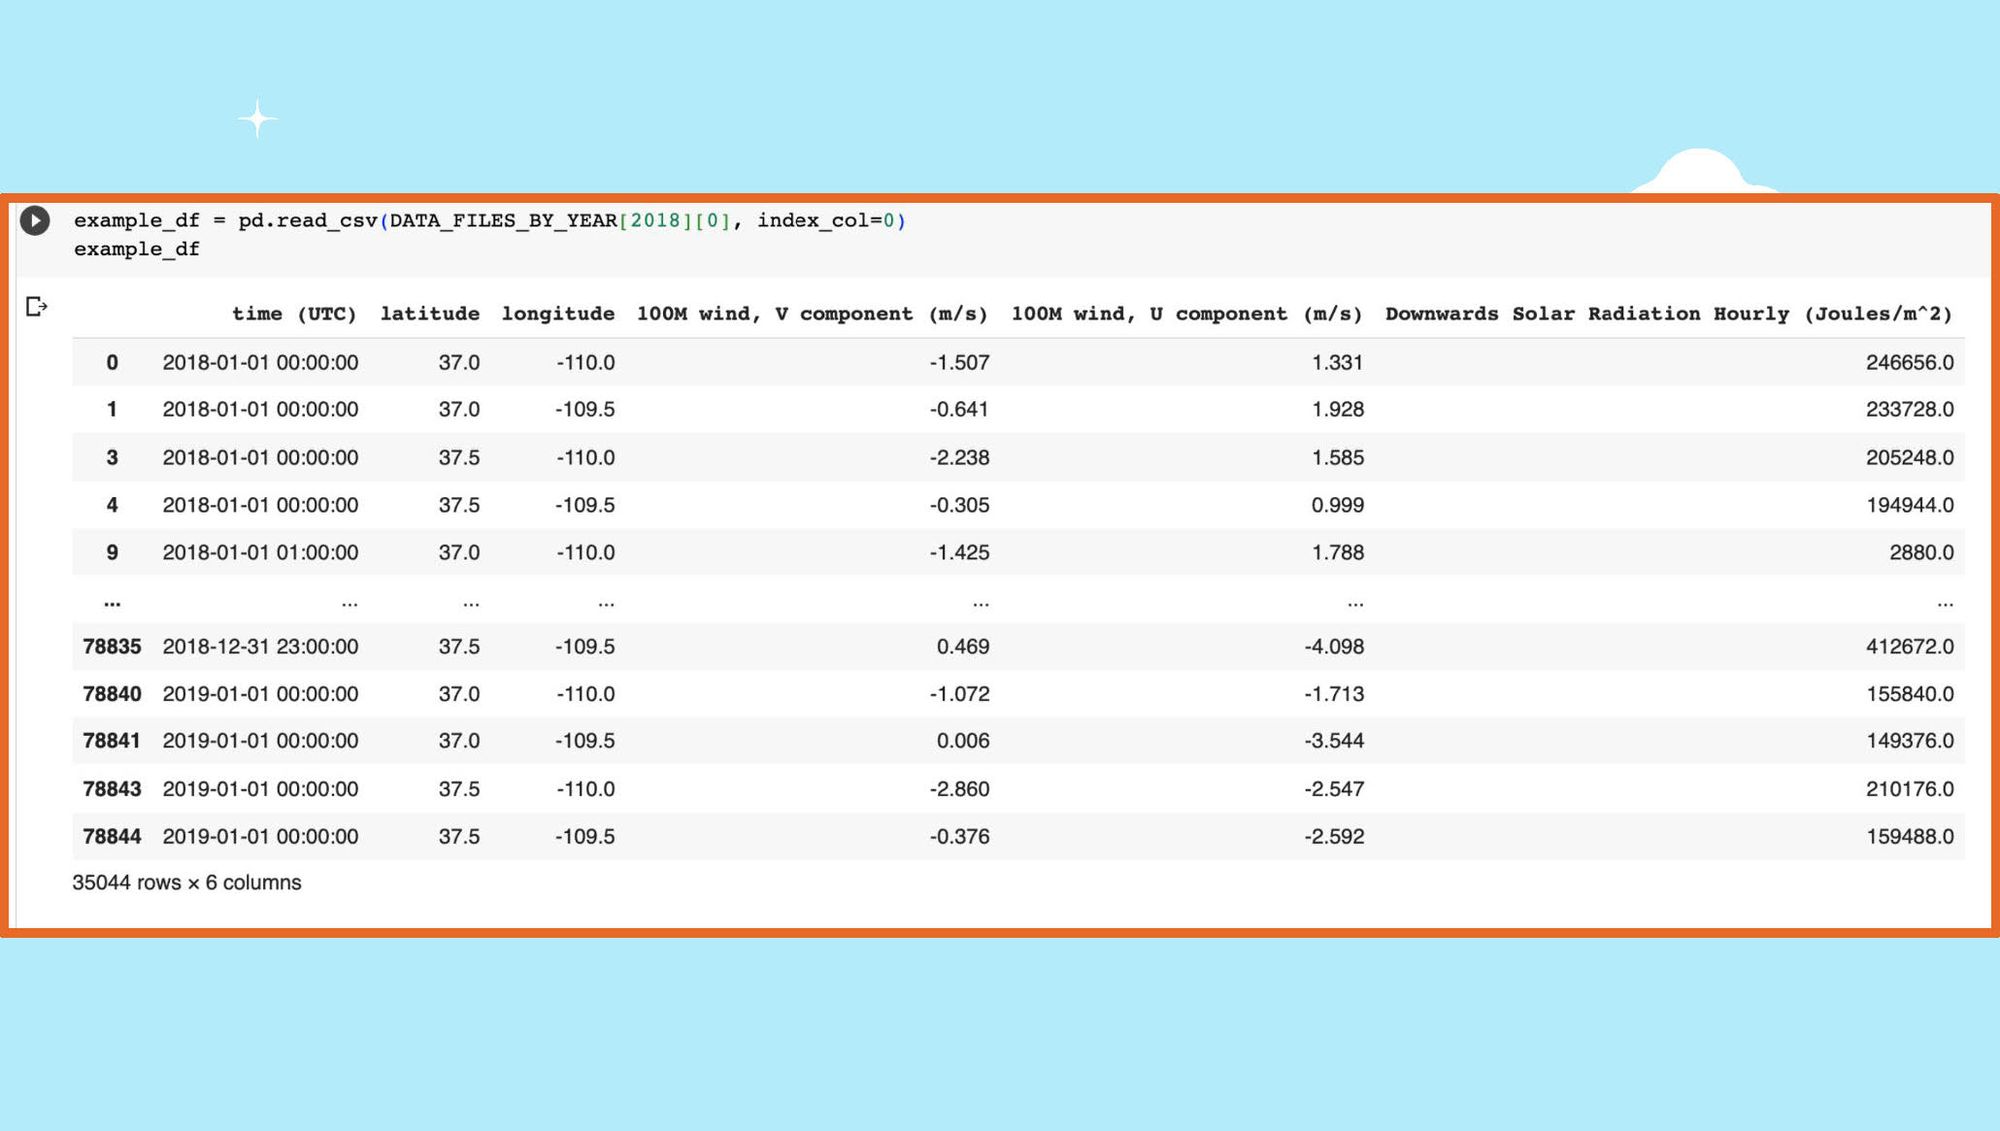
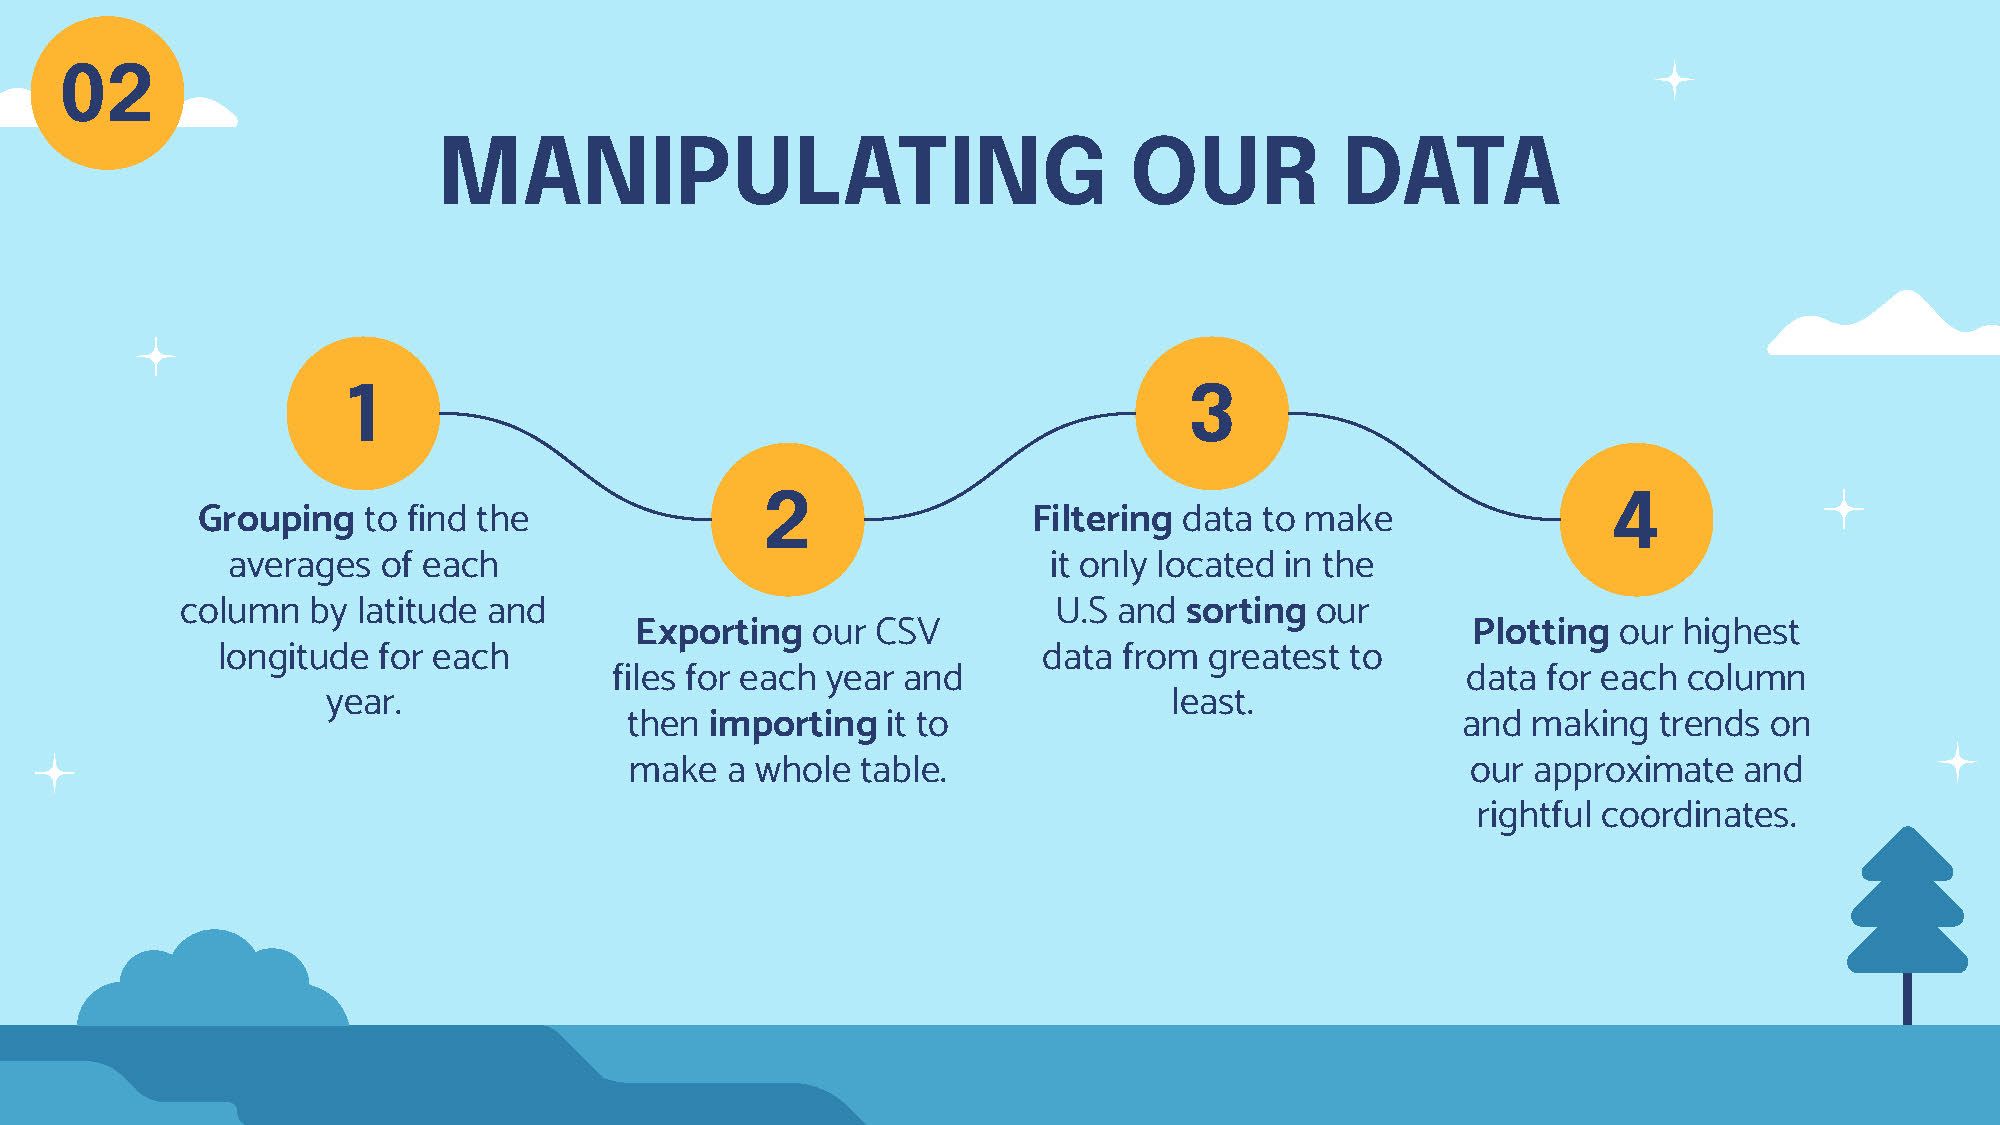
The study project was limited to the United States and used a limited time range from 2018 to 2022. This selection resulted in a dataset containing about 175,000 rows and six columns. The students analyzed and processed this data in five parts to reduce computational power. Every section included one year’s worth of data.
Data Analysis
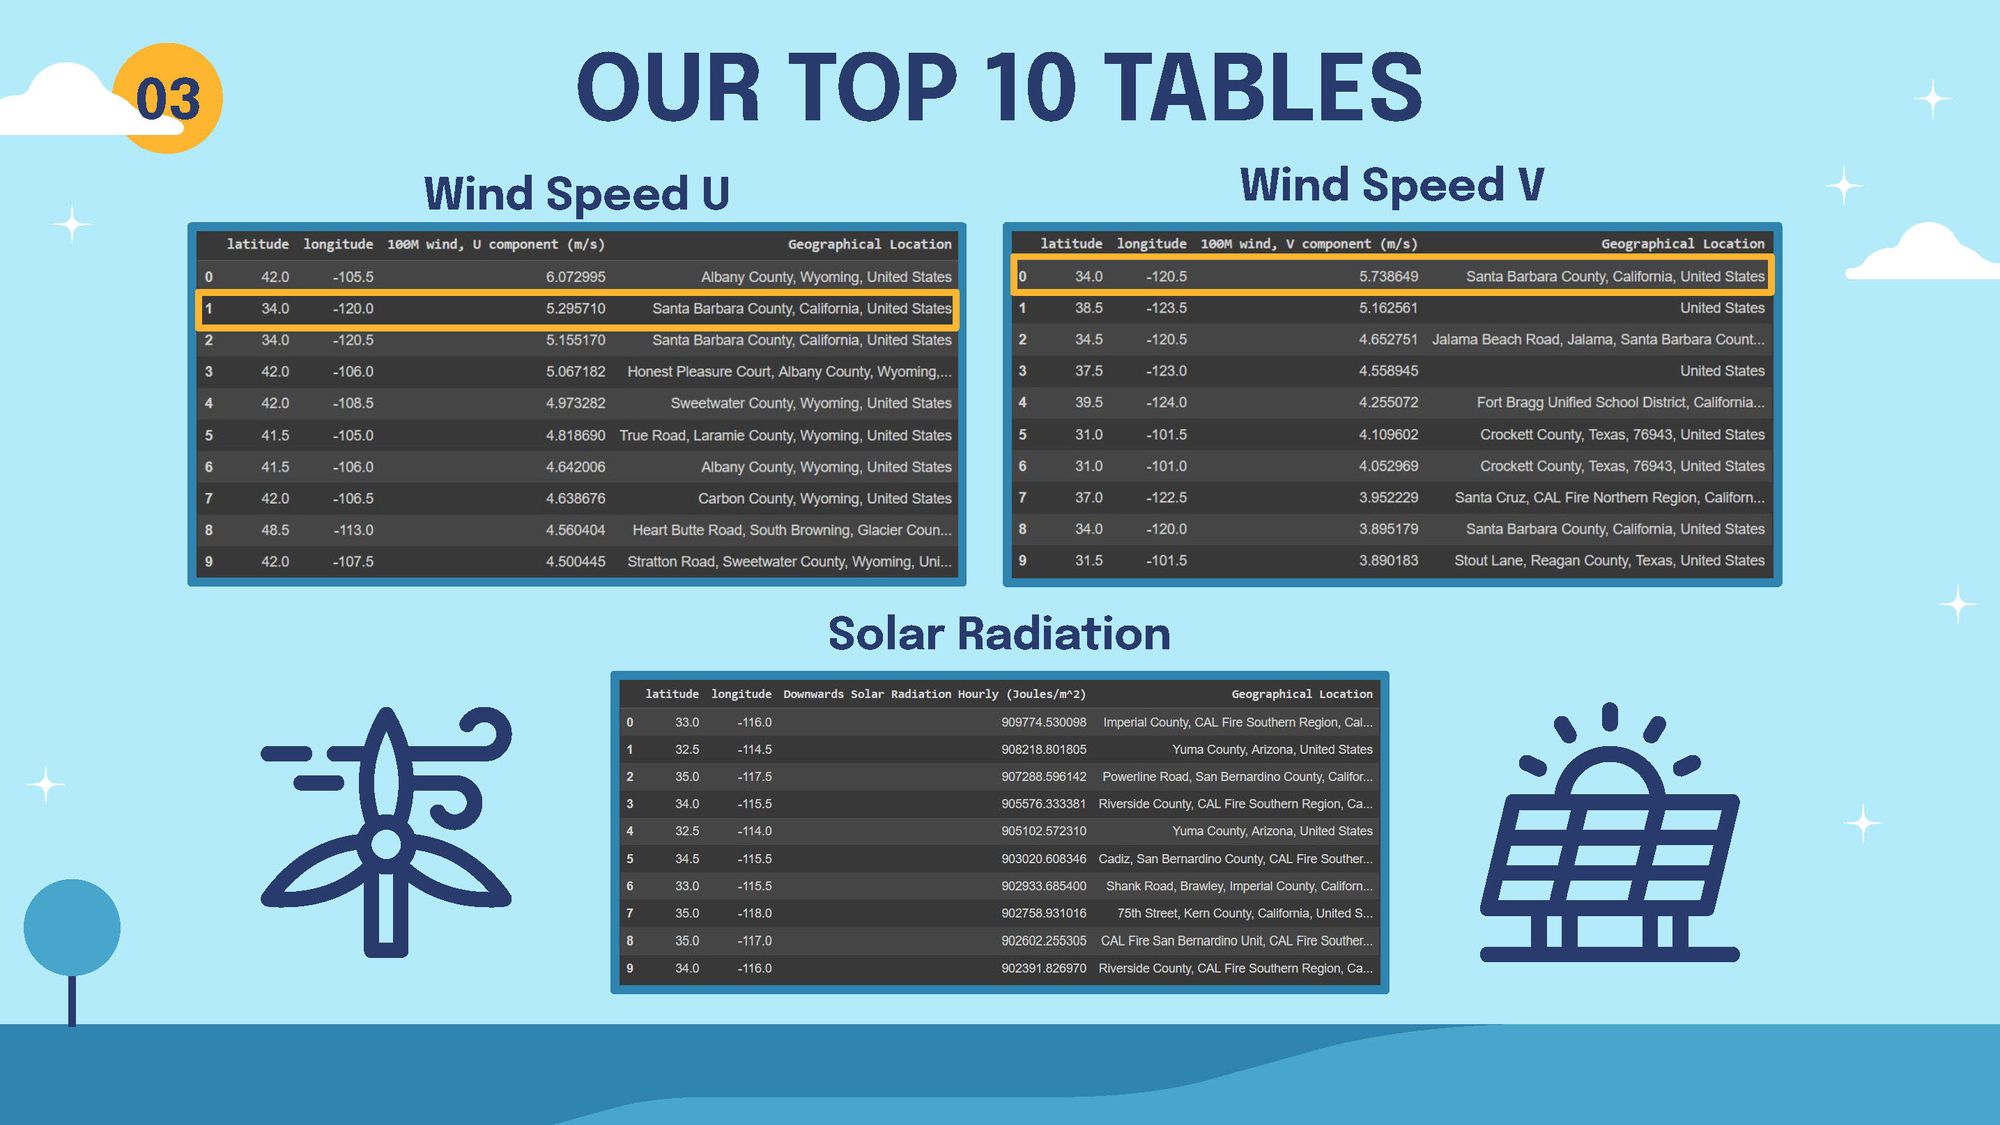
Since the ERA5 dataset contains hourly data, the students first created more appropriate, longer timeframe averages of the wind speed and solar radiation information. They then analyzed the dataset further, combining the V (latitude) and U (longitude) aspects of the wind speed data to find the top 3 US locations with the highest annual wind speed for a wind farm location. The students did the same for solar radiation data. Southern California came out on top, with West Texas as second.
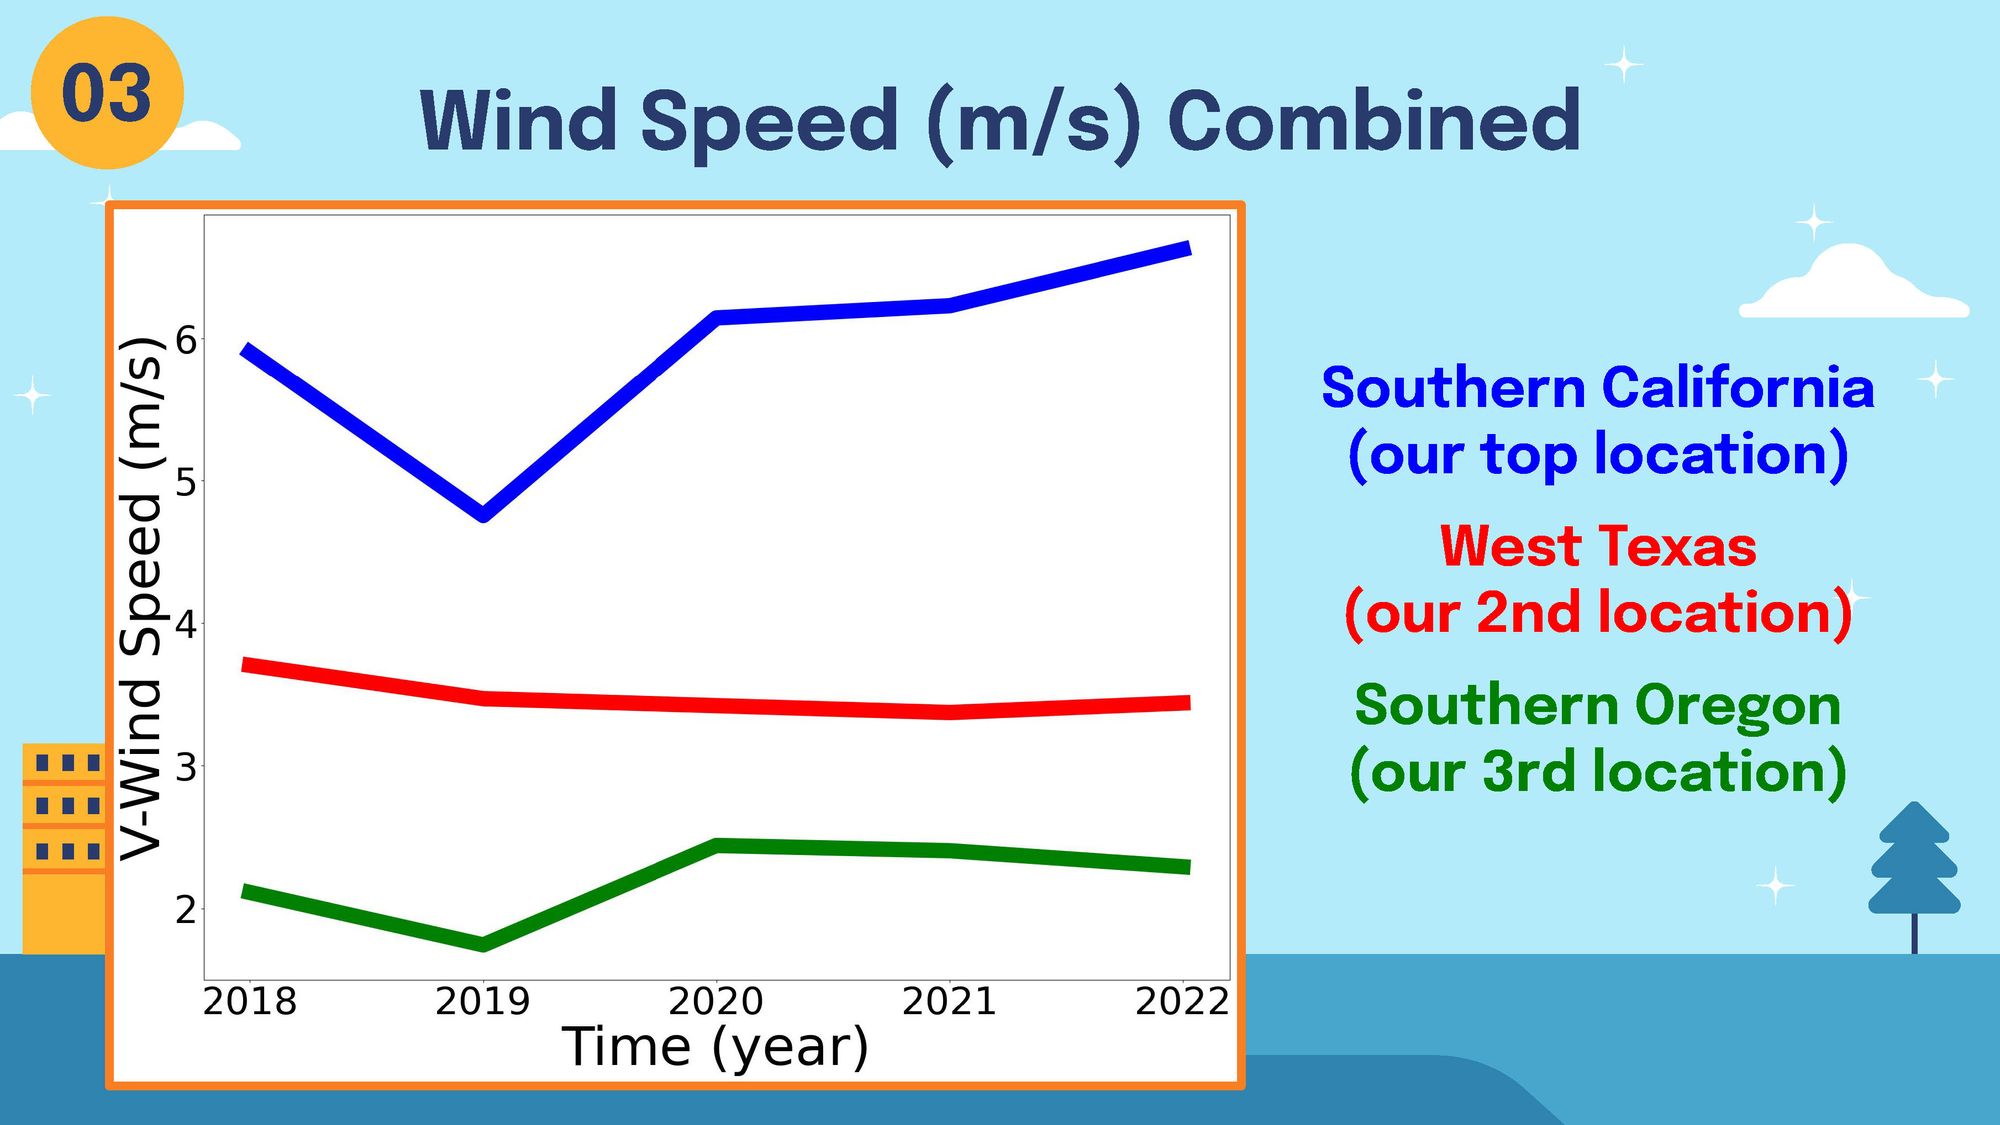
Data Visualization
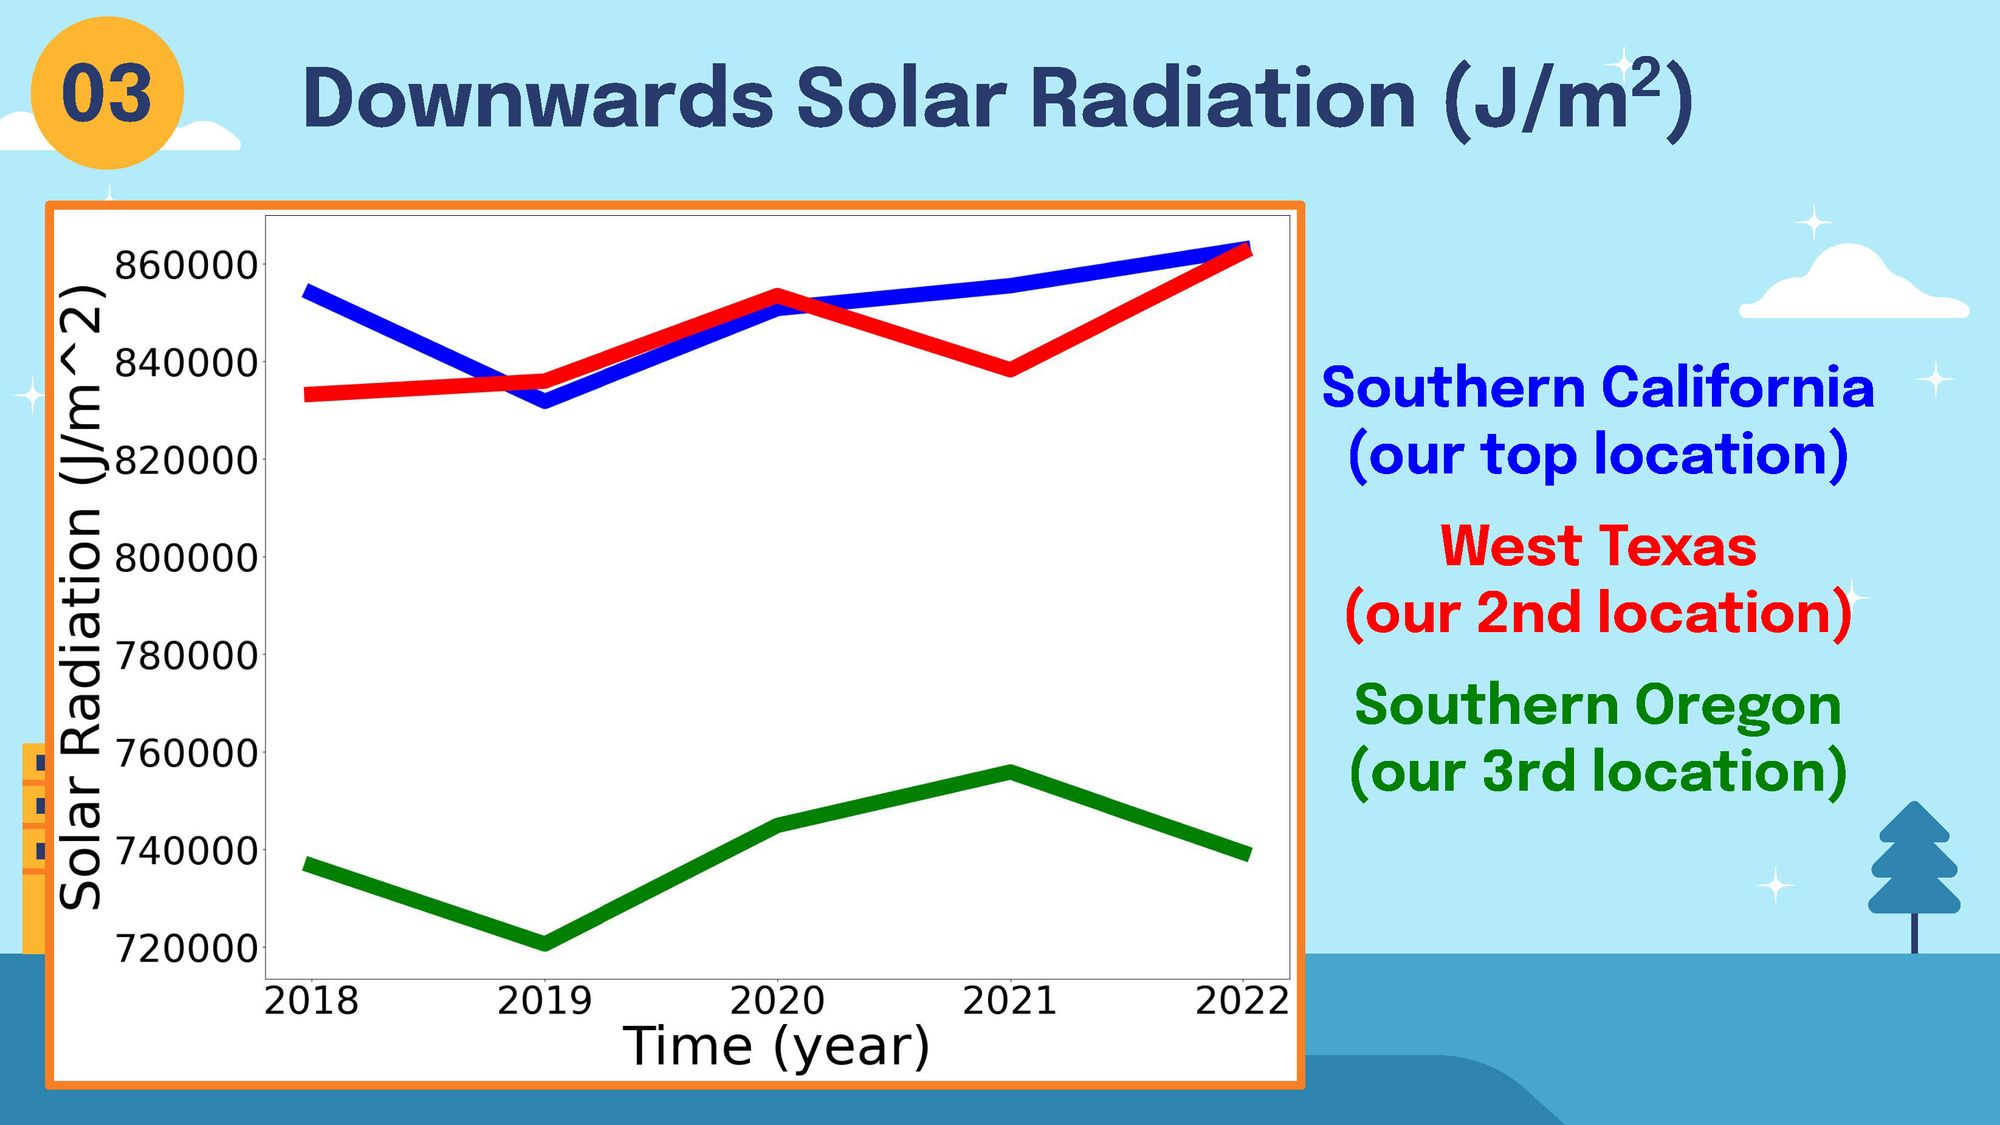
Charts can make data-driven insights easier to understand. The students utilized line charts to visualize the results of their data analysis, relating the top 3 locations to each other. The data visualizations show that Southern California is an ideal location for a wind farm in the United States.
Another benefit of building a wind farm in Southern California is combining it with a solar park generates a more balanced annual electricity output. Wind speeds are typically more substantial during winter, while solar radiation is weaker (and vice versa). Leveraging these natural rhythms can circumvent some of the disadvantageous variability of renewable energy generation.
Conclusion
This study project shows the power of dClimate’s data infrastructure and highlights the ease of use of our platform. With dozens of datasets and 40+ terabytes of free climate data available via our API and marketplace, the possibilities for data-driven climate impact are endless!
This data analysis project shows that open and easily accessible climate data can not only be used by businesses but also empower the next generation of data scientists and leaders, building their skills at an early age and contributing to essential decision-making solutions for benefitting our environment.
We are actively working on more developer tooling, such as several SDKs. More ETL pipelines to expand our collection of Zarr-based datasets are also coming soon, so stay tuned for these improvements!
We Love to Collaborate
dClimate is actively looking to support similar projects - if you are an organization working on climate-related solutions or research, please reach out to our team to discuss further. The easiest way to contact us is by joining our Discord community or emailing community@dclimate.net.
💽 Explore 40+ TB of free climate data via our Data Marketplace and API
🌐 Visit our Website, Blog, and Documentation
📰 Sign up for our bi-weekly Newsletter
🥳 Join the community: Twitter | LinkedIn | Discord | Telegram | YouTube