
Data ReFined #12: The Physical Risks of Record-Breaking Weather

The Newsletter about Climate Data, Regenerative Finance and Climate Risk ⛅
During the last couple of weeks, several record-breaking weather events have occurred. From the highest global average temperatures, to extreme Antarctic sea ice anomalies - the climate data and visualizations clearly show the effects of a changing climate.
As the main section of this newsletter, we like to share several pieces of content that cover the recent historical weather records and climate anomalies. These articles provide insights into the scale of these climate conditions, put the data into context, and bring much needed nuance to these statistics.
The climate risk section highlights the physical risks for businesses such as Walmart. And we share a new report on how U.S. banks are struggling with new financial reporting regulations that includes climate risks.
The final section in this newsletter covers developments from the regenerative finance movement. Our annual ReFi NYC conference is scheduled on Sept. 21, during NYC Climate Week. Mark down your calendar and follow us on Twitter for more details about this unique event!
Let's get into it! ⬇️
🌦️ An Overview of Recent Record-Breaking Weather
Let's start with an overview of the most important extreme weather events of June and July. From dramatic flood events in India to a marine heatwave in the northeastern Atlantic Ocean, this Twitter Thread provides the breadth of climate anomalies that meteorological stations have measured.
🧵Since it is becoming hard to track, here is a thread of the simply astounding weather records planet Earth has started shattering in recent weeks:
— Edgar McGregor (@edgarrmcgregor) July 11, 2023
1. Dramatic flood events have begun striking various countries around the world simultaneously this week. https://t.co/BLiyOyxHHp
Next, in this opinion piece for the New York Times, author David Wallace-Wells argues that the current anomalies in weather events (prolonged heat waves, more frequent extreme storms, more intense rainfall and flooding, massive wildfires, low ice levels in Antarctica and other permafrost areas) could be the new normal by the end of this decade.
He has included many links and references, so you can dive much deeper into these topics if you'd like.
 The New York Times
If you are looking for more graphs and data-driven analysis about the recent record-breaking weather events, this article from Yale Climate Connections has got you covered!
 Yale Climate Connections
Was this newsletter forwarded to you?
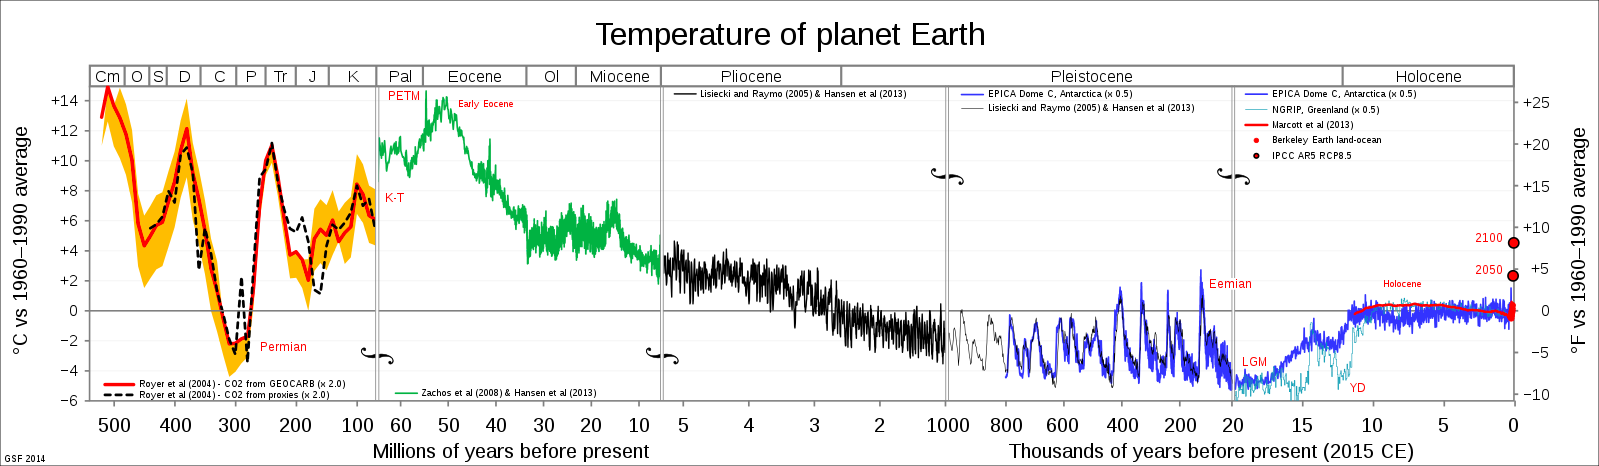
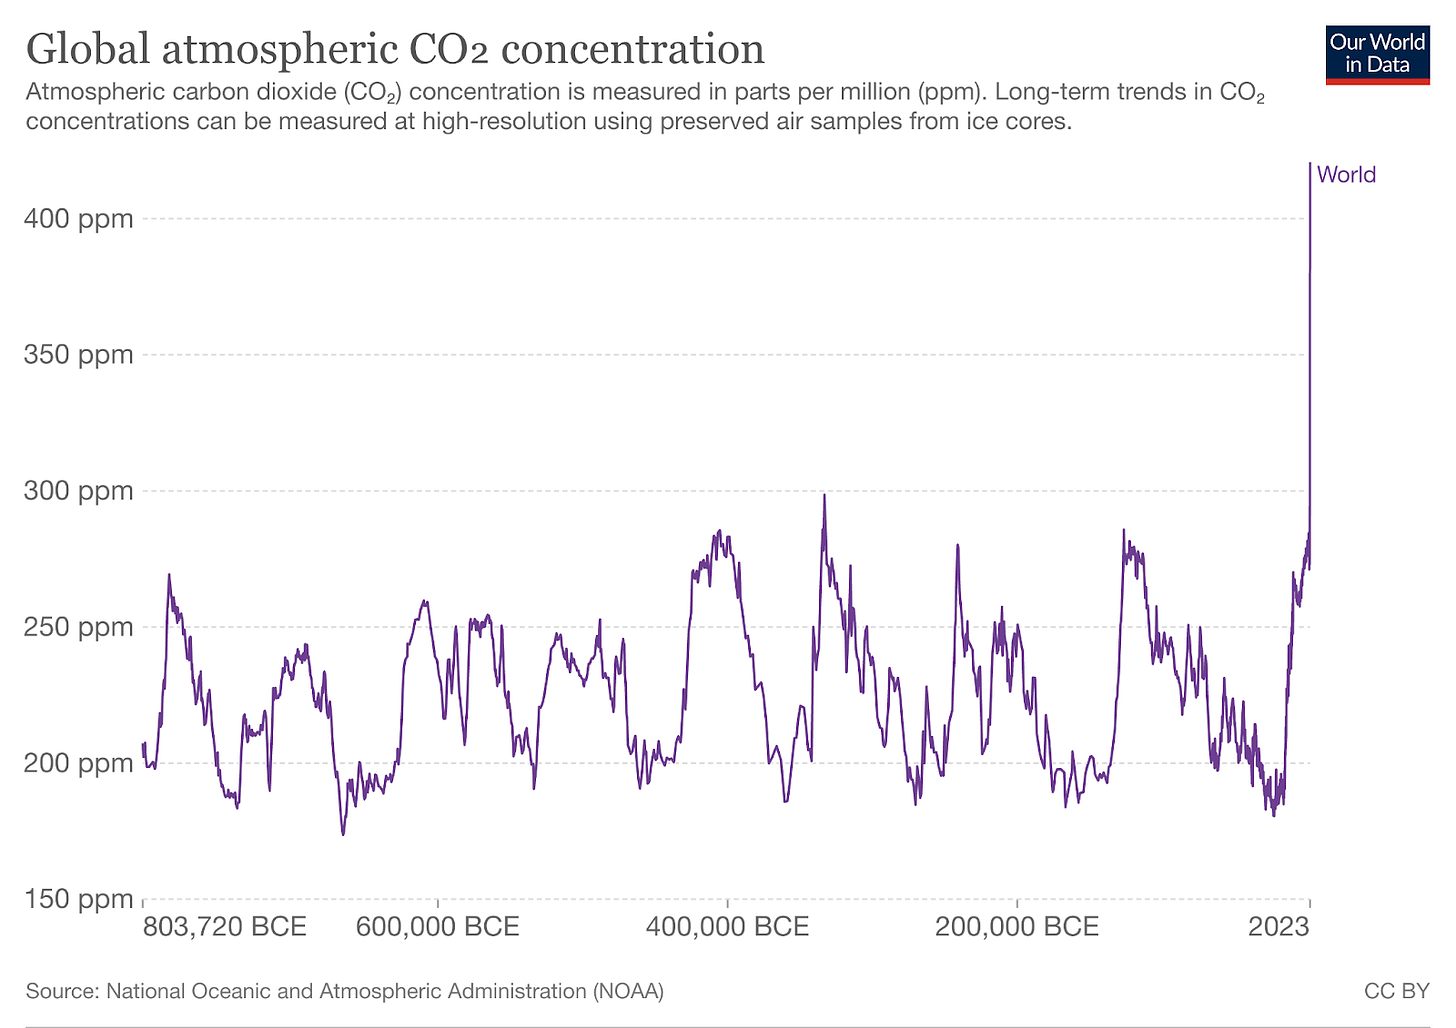
Some of you might be unfamiliar with the geological timescale of Earth's climate record. For others, this item may be a welcome reminder to zoom out and reflect on why you care about climate impact.
There is evidence suggesting that planet Earth has been historically warmer, contained higher concentrations of carbon dioxide in the atmosphere, and experienced higher sea levels than we are measuring now. What is missing in those statistics is humanity, as those climate conditions were almost 3 million years ago.
The modern human has developed in relatively stable climate conditions during the last 12.000 years of the Holocene. The rapid trajectory towards conditions last seen millions of years ago, with many unknown unknowns and possible runaway climate change, is the big existential threat for humanity.

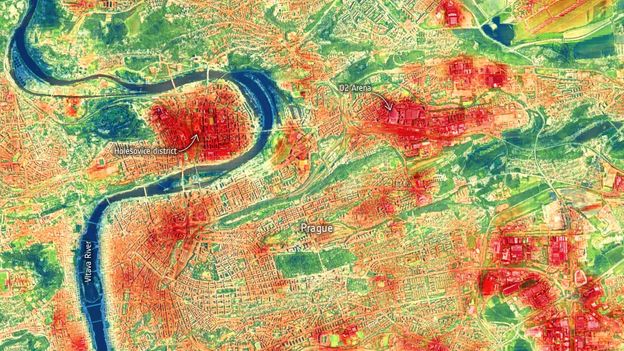
🌳 Satellite Imagery and Urban Greenery During Heat Waves
Due to the urban heat island effect, people living in cities are more affected by heat waves. Urban environments such as New York City can be 7°F (4°C) warmer than its surrounding areas. Heatmaps from satellite data show that greenery and water features can greatly help to reduce the exaggerated effects of heat waves in metropolises.
dClimate's Data Marketplace and API contains over 40 terabytes of free institutional-grade climate data that you can use to create climate insights in your city!
Read our documentation to get started and join our community on Discord to connect with other builders.
🌊 How to Use Satellite Data for Parametric Flood Insurance
This 30 minute conversation with Floodbase on the Instech podcast can give you a better understanding of how climate data and satellite imagery is used for parametric-based flood insurance.
The episode gives you insights into the difference between public satellite data and proprietary satellite data, why floods are more difficult for parametric insurance products compared to hurricanes or earthquakes, and why a lot of damage from storms is now from flooding instead of extreme wind speeds.


🌡️ How do Heat Waves affect Businesses?
This article in Time explains how high temperatures are affecting businesses such as Walmart. The piece also shares insights into more general physical climate risks for corporations.
 Time
Time
💰 Banks and Climate Risk Analytics
Oliver Wyman and the Risk Management Association recently released a report about U.S. banks building out better climate scenario analysis (CSA) and climate risk analytics. Due to regulatory and market pressures, these financial institutions need to get better at managing climate risks.
The research gives insights into the challenges of and opportunities for the banks that need to comply with new reporting standards such as the TCFD (which is being merged into ISSB).
🛠️ Climate-Related Risks in the Construction Industry
Climate change is increasingly affecting the construction industry. Severe weather events can lead to project delays, damaged building materials, and disruptions in supply chains. The current risk models, often based on historical data, are not accurate anymore with rapidly changing climate conditions. The risk managers and insurers need more forward-looking climate risk analytics.
"When we talk about one-in-500-year events, we know that those assumptions are false. The US Gulf of Mexico has had three one-in-500-year events in 5 years."
 home
home

🗽 Save the Date for ReFi NYC!
On September 21, 2023 we are organizing a unique one-day conference in New York City, called ReFi NYC. Our event is focused on the growing regenerative finance movement and brings together climate tech businesses, data engineers, climate scientists, and ReFi enthusiasts from all over the world!
We are all working on verifiable climate impact, increasing integrity in carbon markets, or other novel and data-driven approaches to climate action. So let's connect, network, share and learn.
Our conference is during NYC's Climate Week, so combining it with other activities and events is possible. Mark down September 21 in your calendar and stay tuned for more details over the summer.
You can apply for a speaker or sponsor slot via the website below! 👇

🌱 Democratizing Access to Climate Finance
This podcast episode of This Week in ReFi hosts a conversation with the CEO of Solid World. They talk about the why, what and how of Solid World, and discuss the recent public beta launch of their climate finance platform.
🌳 A Virtual Sustainable Blockchain Summit
After a series of in-person conferences, the next Sustainable Blockchain Summit will be a free virtual event and is planned for August 16, 2023. This conference organized by Filecoin Green is one of the bigger ReFi events. You can reserve your spot via the SBS website.
💌 You’re invited to join our mission to harness blockchain's potential for a cleaner, more sustainable tomorrow.
— Sustainable Blockchain Summit (@SBS__Tech) July 10, 2023
🌎 What: #SBSEarth
📍 Where: Virtual
🗓️ When: August 16th
💻 How: https://t.co/EjzGw4T10q pic.twitter.com/N7QdIPoP8z
Your support is much appreciated! 💙
Thank you for reading this edition of our newsletter and being a part of our growing community! Please share this publication with friends, family and co-workers to increase awareness about the important climate topics we cover.
Learn more about the decentralized and open climate data ecosystem we are building via the links below!
💽 Explore 40+ TB of free climate data via our Data Marketplace and API
🌐 Visit our Website, Blog, and Documentation
📰 Sign up for our bi-weekly Newsletter
🥳 Join the community: Twitter | LinkedIn | Discord | Telegram | YouTube